| ACCESSIBILITY RESOURCES CENTER |
|---|
| MEASUREMENT | GOAL | GRAPH |
|---|
| Courses and instructors served in AY 18-19 | Benchmark to plan outreach to serve more courses and instructors |  |
| Documents processed in AY 18-19 | Benchmark for resource planning to meet demand |  |
| Instructors served by term | Increase number of instructors using ARC services |  |
| INFORMATION SECURITY |
|---|
| MEASUREMENT | GOAL | GRAPH |
|---|
| Number of accounts locked by month | Steady or declining numbers |  |
| Training sessions assigned/completed | Reduce number of overdue sessions/ repeat victims of phishing attacks |  |
| Incident types over time | |  |
| Labs & Smart Classrooms |
|---|
| Measurement | Goal | Graphs |
|---|
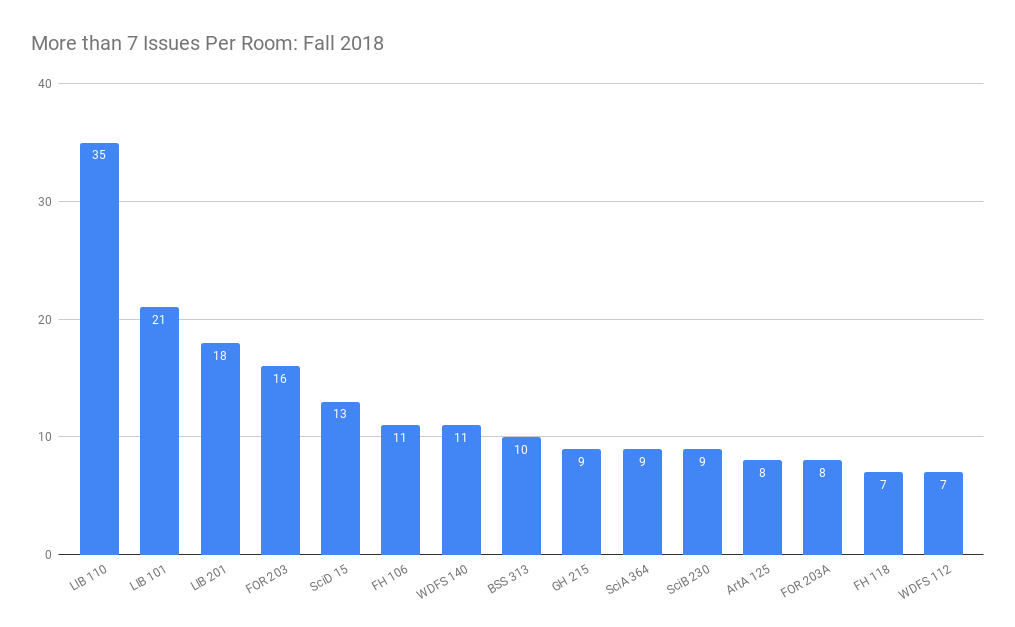
Rooms with more than 7 trouble tickets per room. | Goal: 80% of rooms with fewer than 7 tickets per semester. Currently: 92% meet this goal. | 
Only 8% of the 194 supported rooms had 7 or more tickets created during the Fall 2018 semester.
|
The average number of tickets per computer per location. | Goal: 80% of rooms with fewer than 3 tickets per semester per computer Currently, 90% meet this goal. | 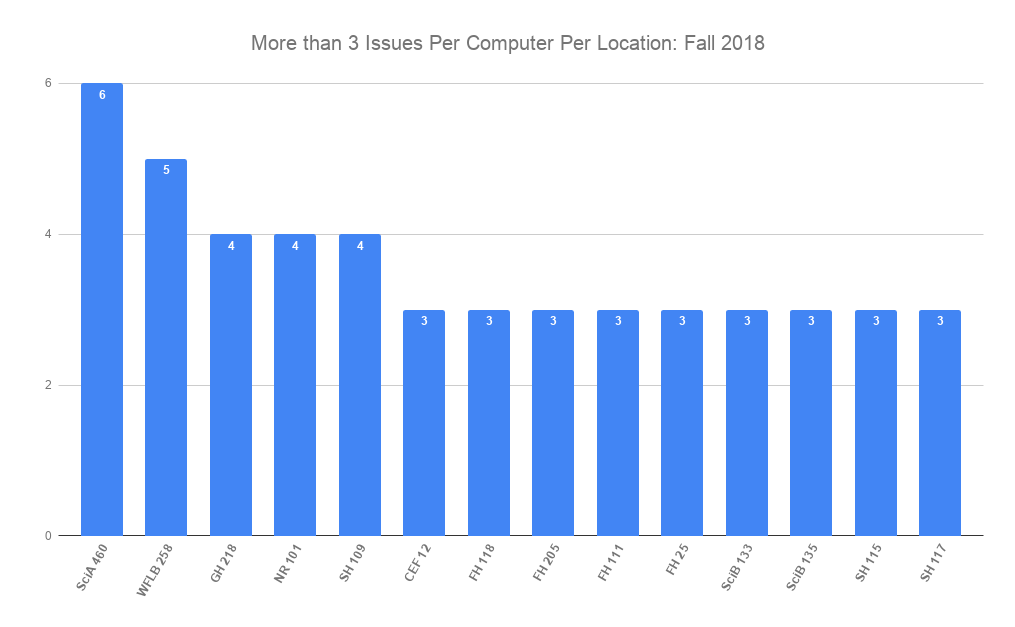
To identify the highest return on effort, this statistic captures issues per computer per location. 10% of 194 rooms show a high number of issues. |
The number of instructor stations that boot in <100 seconds | Goal: 100% of instructor stations boot in under 100 seconds. Currently: 100%. GOAL MET! |  Boot time is calculated from power-on to a browser displaying a web page. |
OBI |
|---|
| Measurement | Goal | Graph |
|---|
| OBI and data availability | OBI data available 99% of the time. Currently, OBI data is available 96.9% of the time. |  |
| Pay-for-Print |
|---|
| Measurement | Goal | Graph |
|---|
| Pay-for-Print page counts | Steady or declining use of paper. | 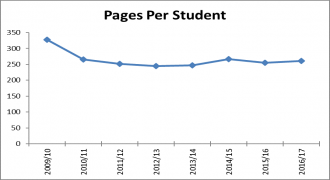
Numbers for 2009/10 apply only to interdisciplinary labs; from 2010/11 onwards, the numbers also include departmental and other Humboldt labs |
Pages used per semester student headcount | | 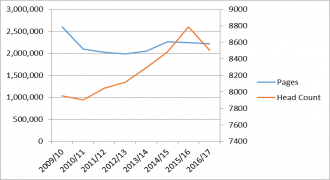 Numbers for 2009/10 apply only to interdisciplinary labs; from 2010/11 onwards, the numbers also include departmental and other Humboldt labs |
|
|---|
| Measurement | Goal | Graph |
|---|
On-time project delivery | 70% of projects maintain on-time status. | 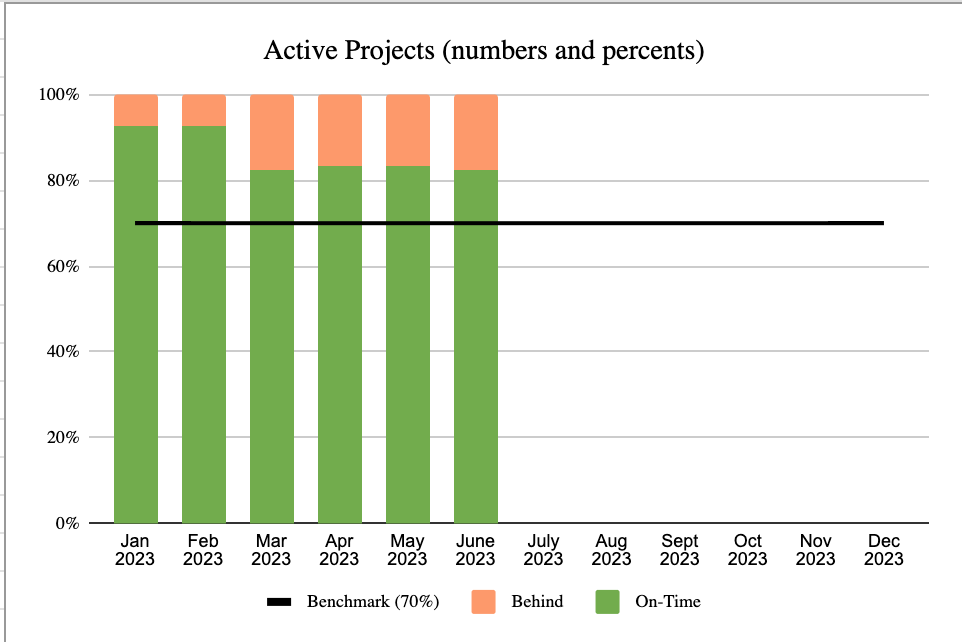
Project timeliness is measured for all active projects as well as whether closed projects were delivered on schedule. |
Project completion status | 70% of projects are closed on time. | 
Project timeliness is measured for all active projects as well as whether closed projects were delivered on schedule. |
| System Administration |
|---|
| Measurement | Goal | Graph |
|---|
Data Center power usage | Reduce overall power usage and number of physical servers through virtualization while increasing services offered | 
|
Storage footprint | Reduce local storage footprint by taking advantage of cost efficient cloud resources. |  |
| Telecommunications & Network Services |
|---|
| Measurement | Goal | Graph |
|---|
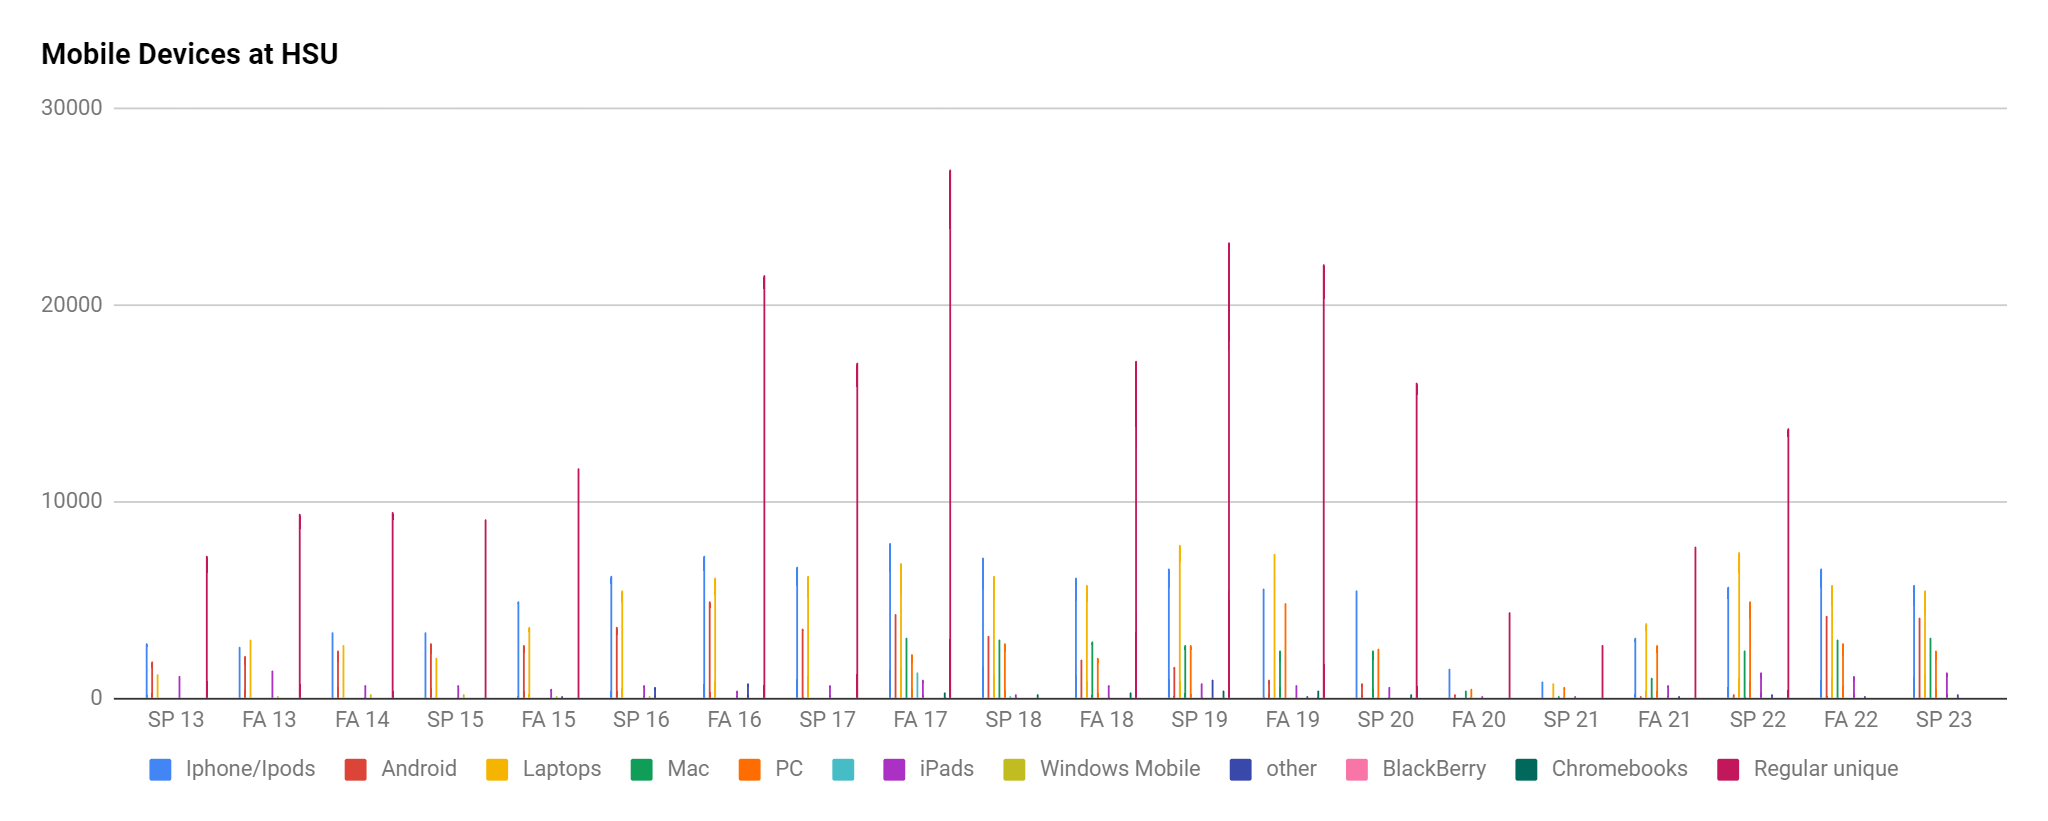
Wireless access points on campus | Sufficient coverage across campus | 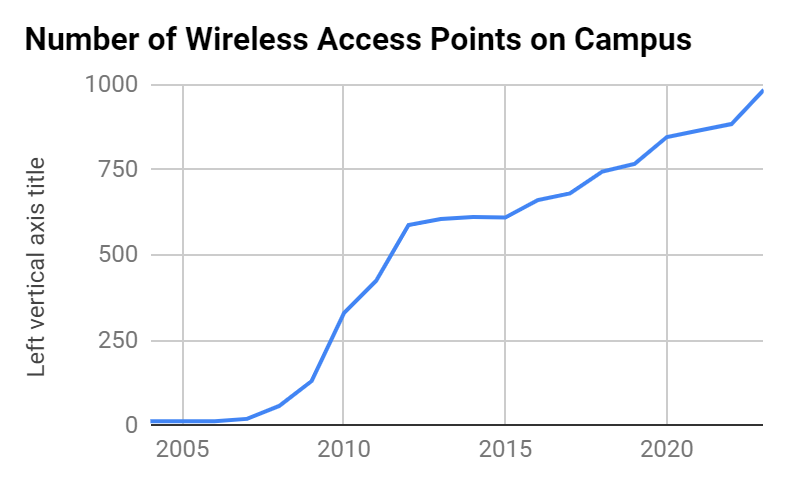 |
Wireless device types supported | |  |
| Technology Help Desk |
|---|
| Measurement | Goal | Graph |
|---|
| Number of different types of support requests at the Technology Help Desk throughout the day. | Set a baseline to get a better understanding of the Technology Help Desk demands to assist in staffing the call center and help desk appropriately for peak and low times |  |
| Distribution of different types of customers support by the Technology Help Desk | Set a baseline to get a better understanding of our customer base in order to improve service. |  |
| Support request escalation | At least 90% of support requests resolved by Tier 1 support |  |
| Time to resolution for support requests | At least 90% of support requests are resolved in 5 min or less |  |
| Overall satisfaction rating across ITS derived from surveys submitted after closure of Technology Help Desk tickets | Average rating of 4.5 or more (4.9 for FY18/19). Decreased number of "poor" ratings |  |
| Distribution of different types of customers supported by the Technology Help Desk throughout the day | Set a baseline to get a better understanding of our customer base as it varies throughout the day in order to improve service |  |